Industry
CPG


CPG

AMER

Price Optamization Application
The client, a global distributor for plumbing supplies, sold products to over 100k customers, in just one demographic, Texas, and just within 2 years. The pricing team of the company had to ensure that all products in its extensive portfolio were being sold at the right price structure.
However, the sales team had the ability to negotiate these prices with the customer, and in instances, could even override the centrally recommended price set by the pricing team. As a result, 50% transactions and 70% revenue were attributed to products sold at a price other than the centrally recommended price.
Adding further complexity to this was the fact that the customer was using a legacy framework of 38 customer segments to implement its pricing strategies. These segments had been created over time, based on subjective and often inconsistent inputs from the field sales.
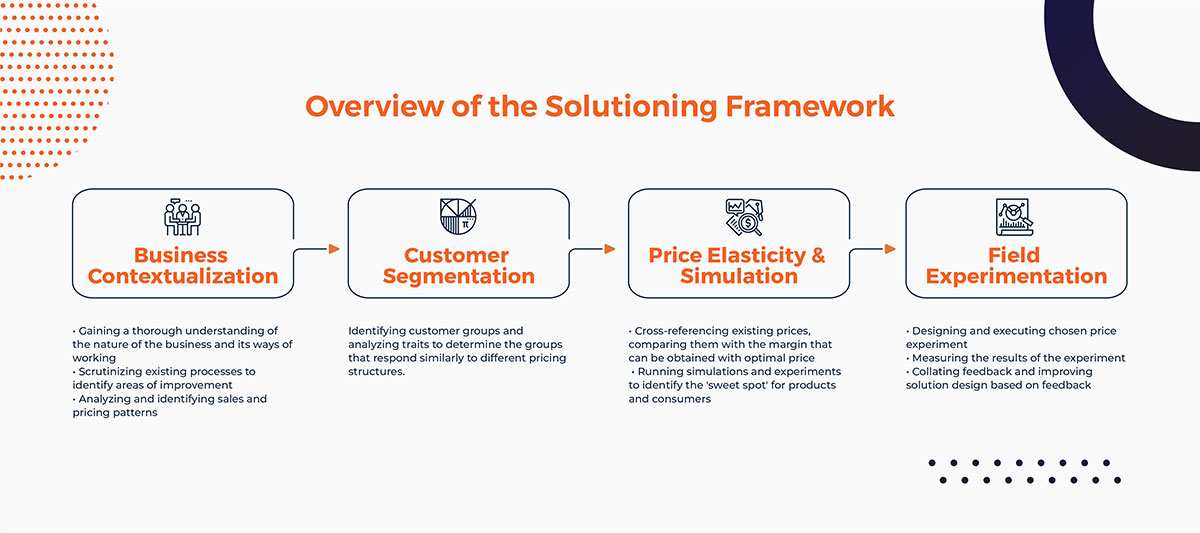
To optimize product level pricing, four key steps were undertaken by TheMathCompany:
Here’s a deep-dive into the multi-step solutioning process undertaken by TheMathCompany to determine optimum pricing structures:

Fig (i) Overview of the Solutioning Framework
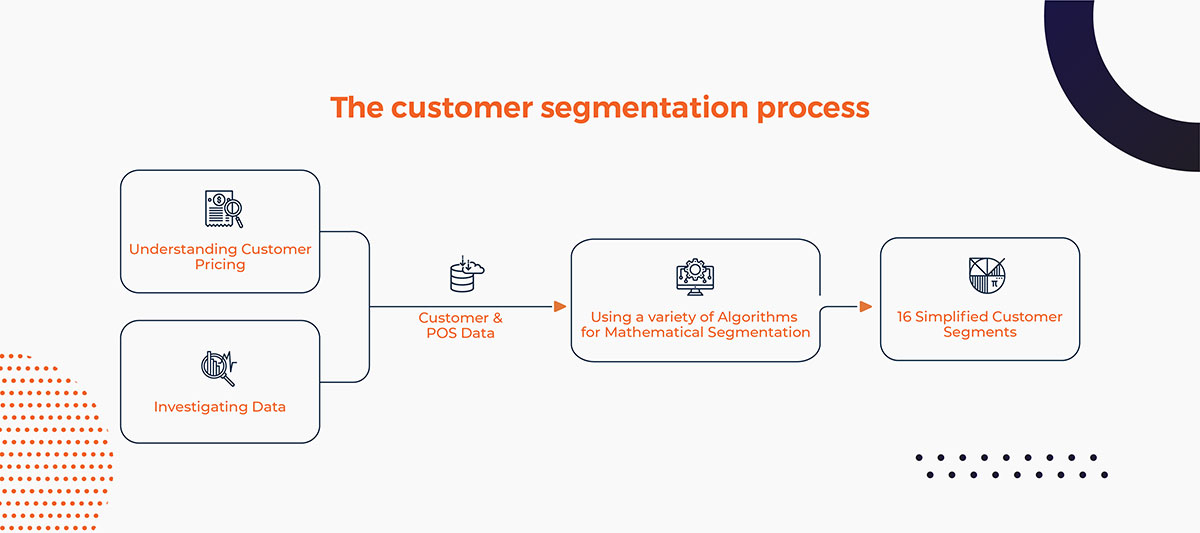
After gaining business context, the team evaluated existing customer segments and worked towards simplifying it to ensure that it is aligned with existing customer behavior. Factors like historical purchase frequency & value, sensitivity to price changes, engagement levels, size of the customer’s business, customer’s industry, etc., were considered. A variety of segmentation algorithms were explored to zero in on a combination of heuristic and tree-based algorithms to group customers into 15 simplified segments.

(Fig ii) The customer segmentation process
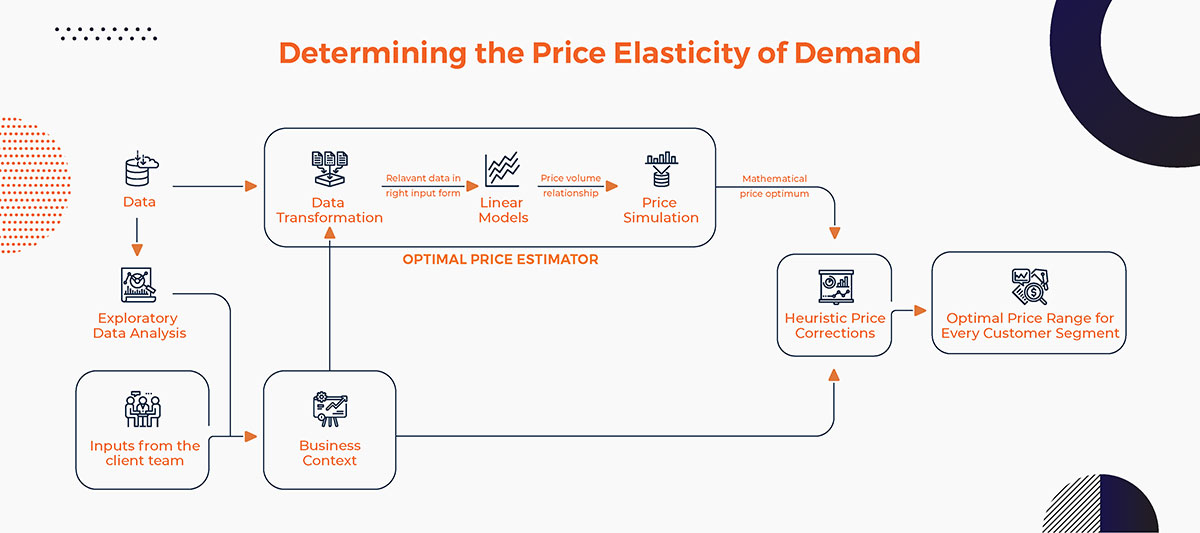
For each combination of product and customer segment, individual linear models were built to determine the Price Elasticity of Demand (PED), which, in turn, was used to simulate the impact of different price points on profitability to determine the optimal price. This resulted in recommendations of price increases for a selection of products, taking advantage of their lower elasticity and price drops for other overpriced products with higher elasticity.

(Fig iii) determining the Price Elasticity of Demand
A carefully constructed set of A/B tests was chosen to run price experiments that would test the optimal prices in the field. This step helps build confidence with key stakeholders, while also allowing the team to gather critical feedback to refine the price structure, wherever necessary.
For the same, 50 combinations of products and customer segments were selected keeping a few key factors in mind:
Statistical power analysis was undertaken to determine the right sample size for the number of transactions required, which, in turn, was key to determining the number and mix of customers, as well as the duration of the experiment. Finally, a Power BI dashboard was designed to help key business stakeholders track the impact of the price changes on a variety of key metrics, including profit, adoption by the field sales team and customer feedback.
In all, the resulting solution unlocked a potential annual profit of $15.6 million for the client company and the optimal price range was successfully tailored to each of the customers in the target demographic comprising 100k customers across a portfolio of 7k products.nbsp;

Blogs April 8, 2021
Q&A with Nabeel Ahmed: Marketing Analytics in the Automotive Industry
Blogs June 6, 2022
How Hyper-Personalization is Shaping Patient Support Programs
Blogs June 7, 2022
Architecting MLOps Solutions for Healthcare
Blogs July 23, 2022
Unlocking Experiential Automotive Marketing with AI & ML
Blogs Oct. 20, 2022
The AI Bill of Rights: A welcome step toward tech accountability
Blogs July 15, 2022
How CPG Businesses are Utilizing Data to Mitigate Inflationary Risk
Stay up to date with the latest marketing, sales, and service tips and news.

Subscribe to our newsletter to receive latest updates